
The market’s probable direction, at a glance.
Brief, clear, concise market data for stock investors and shorter-term traders. Six signals, one score, one regime. No noise.
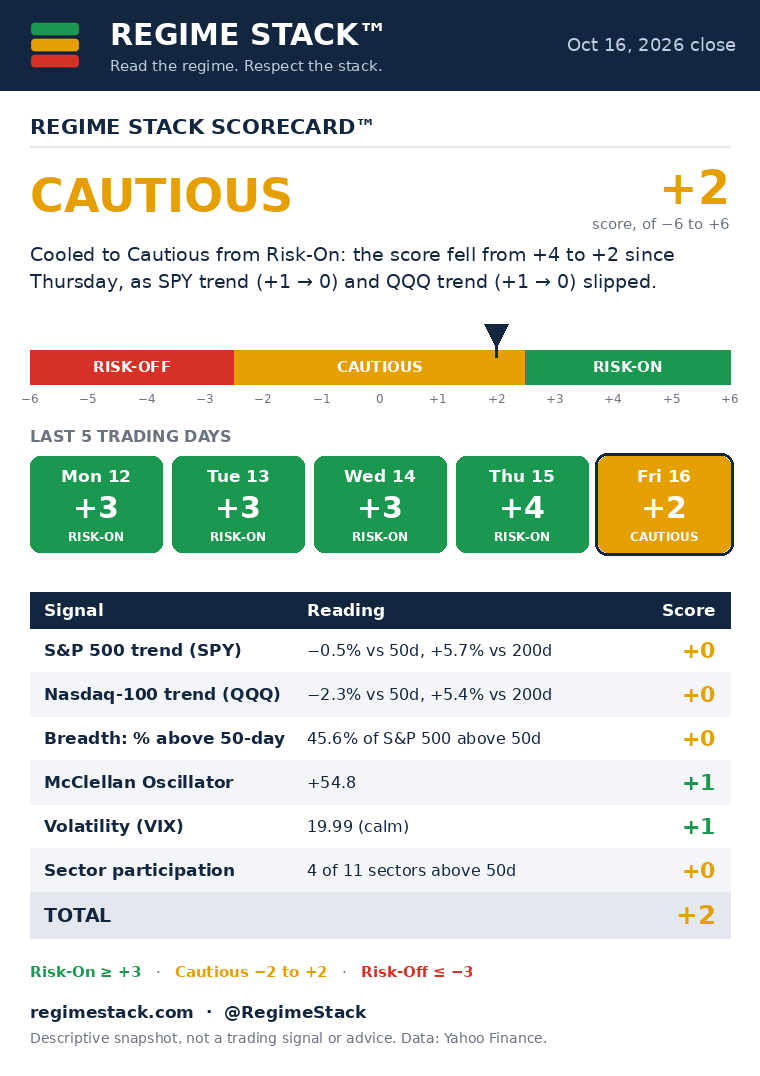
How the Scorecard works
Each trading day, six signals are each scored +1 (supportive), 0 (neutral) or −1 (weak). Added together they give a total from −6 to +6, and the total sets the regime.
Trend guardrail: if SPY closes below its 200-day moving average, a Risk-On reading is capped at Cautious.
The six signals
1S&P 500 trend (SPY)
Where the S&P 500 ETF sits relative to its 50-day and 200-day moving averages.
2Nasdaq-100 trend (QQQ)
The same trend read for the Nasdaq-100 ETF, the growth and tech-heavy side of the market.
3Breadth: % above 50-day
The share of S&P 500 stocks trading above their own 50-day average. Are most stocks participating?
4McClellan Oscillator
A momentum gauge built from daily advancing versus declining issues.
5Volatility (VIX)
The market’s expected volatility. Calm, normal or stressed.
6Sector participation
How many of the 11 S&P 500 sectors are trading above their 50-day average.
Data, presented differently
Regime Stack is not a stock-picking service and not investment advice. It is market data, scored mechanically and presented in a unique, readable format, so you can judge the backdrop for yourself.
Get the daily card
The Scorecard is posted after the close on X at @RegimeStack and updated here.
Questions: hello@regimestack.com